Libraries and connection parameters are provided here.
Show the code
library(RMySQL)library(readr)library(dplyr)library(knitr)library(ggplot2)library(lubridate)# Set up the connection parametersdb_host <-"127.0.0.1"# Localhost addressdb_user <-"root"# Your MySQL usernamedb_password <-""# Your MySQL passworddb_name <-"emu415_dataciphers"# The name of your database# Establish the connectiondb_connection <-dbConnect(RMySQL::MySQL(), host = db_host,user = db_user,password = db_password,dbname = db_name)
1 Team Members
Show the code
# Define the SQL querysql_query <-"SELECT first_name, last_name, email, birthdate FROM team_members;"# Execute the SQL query and retrieve the resultsresults <-dbGetQuery(db_connection, sql_query)# Display the resultskable(results)
first_name
last_name
email
birthdate
Mert Bekir
Kaplan
mert_kaplan@hacettepe.edu.tr
2000-07-18
Ahad Tanay
Uyar
tanayuyar@hacettepe.edu.tr
2001-01-12
Dilan Su
Fırat
sufirat@hacettepe.edu.tr
2000-06-09
Miray Elif
Erdemli
mirayerdemli@hacettepe.edu.tr
1999-02-18
Mert
Çetinkanat
mertcetinkanat@hacettepe.edu.tr
2001-10-05
Jale Begüm
Bahçekapılı
begumbahcekapili@hacettepe.edu.tr
2002-09-16
Sena Nur
Enşici
senaensici@hacettepe.edu.tr
2000-03-10
Arda
Türkan
ardaturkan@hacettepe.edu.tr
2002-01-17
Ayşenur
Eren
aysenur.eren@hacettepe.edu.tr
2001-05-23
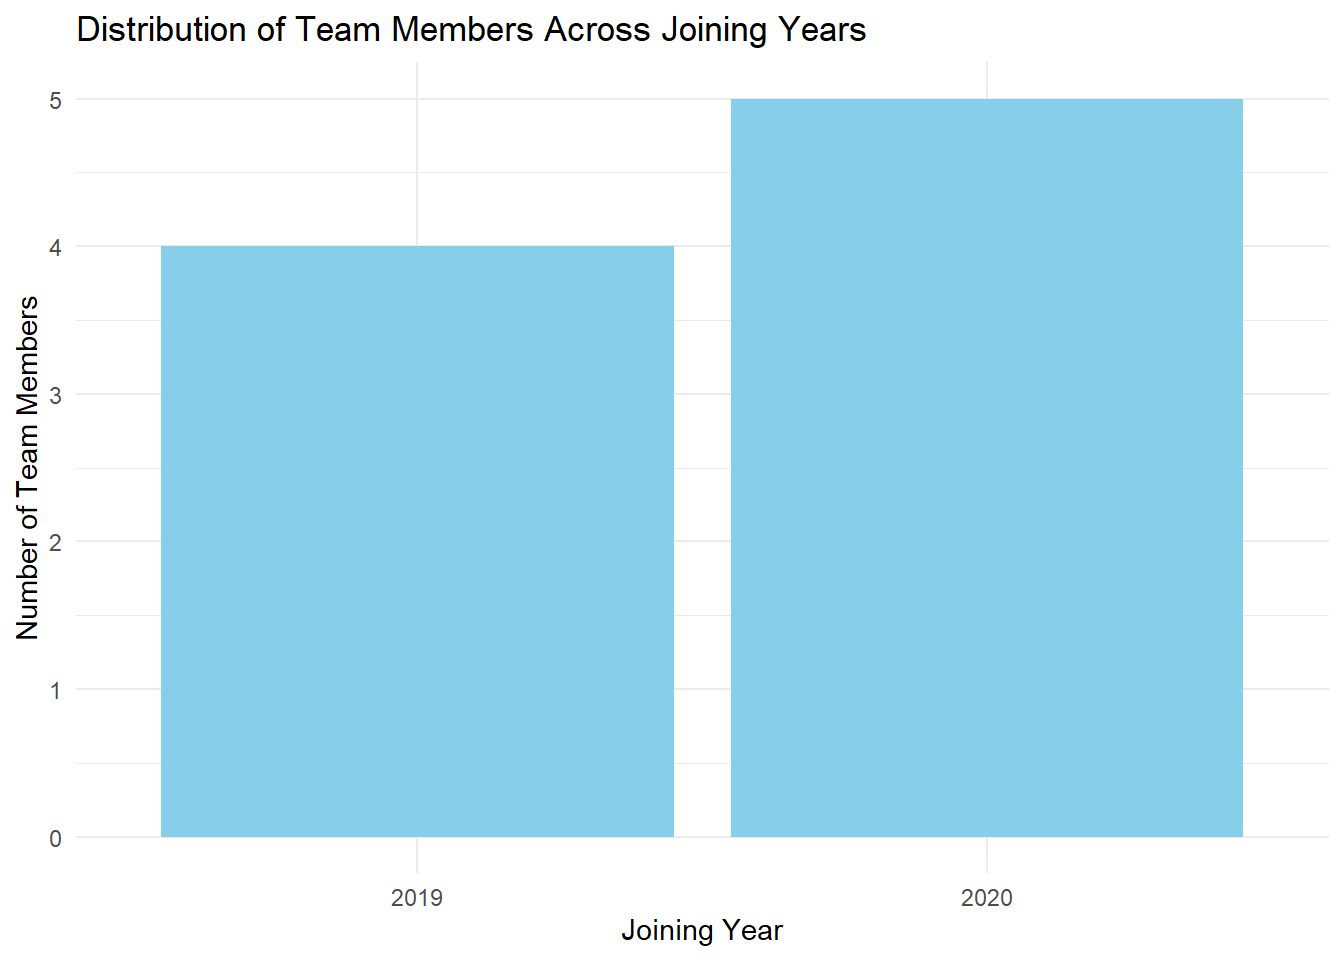
2 Distribution of Team Members Across Joining Years
Show the code
# Define the SQL querysql_query <-"SELECT join_year, COUNT(*) AS num_members FROM team_members GROUP BY join_year;"# Execute the SQL query and retrieve the resultsresults <-dbGetQuery(db_connection, sql_query)# Convert join_year to factor to maintain order in the plotresults$join_year <-factor(results$join_year, levels =unique(results$join_year))# Plot the distribution of team members across different joining yearsggplot(results, aes(x = join_year, y = num_members)) +geom_bar(stat ="identity", fill ="skyblue") +labs(title ="Distribution of Team Members Across Joining Years",x ="Joining Year",y ="Number of Team Members") +theme_minimal()
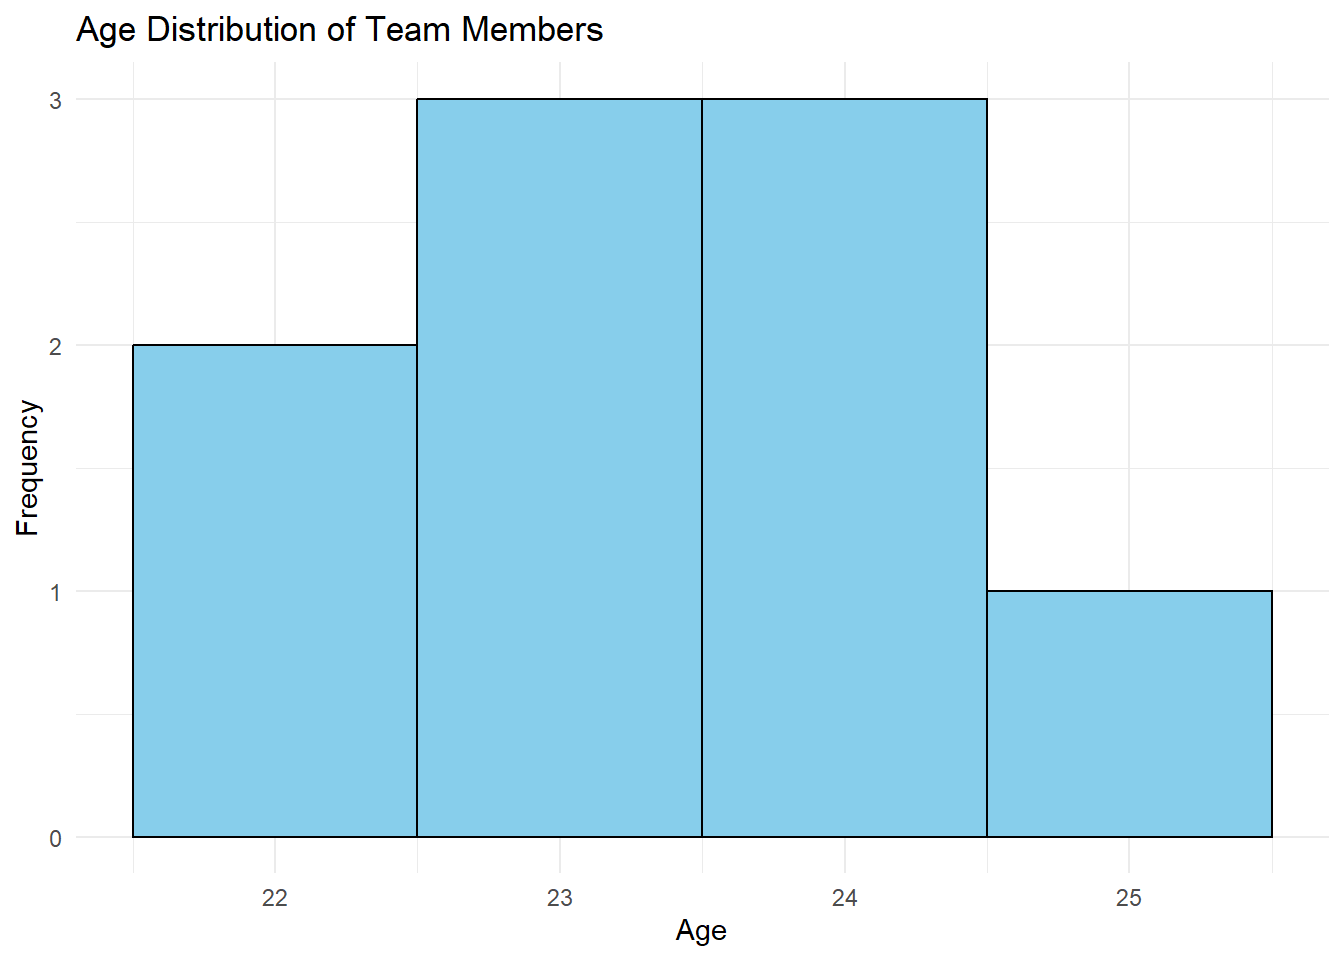
3 Age Distribution of Team Members
Show the code
# Define the SQL query to fetch birthdate datasql_query <-"SELECT birthdate FROM team_members;"# Execute the SQL query and retrieve the birthdate databirthdate_data <-dbGetQuery(db_connection, sql_query)# Convert birthdate to date typebirthdate_data$birthdate <-as.Date(birthdate_data$birthdate)# Calculate age from birthdatebirthdate_data$age <-as.numeric(difftime(Sys.Date(), birthdate_data$birthdate, units ="days")) /365.25# Plot age distributionggplot(birthdate_data, aes(x = age)) +geom_histogram(binwidth =1, fill ="skyblue", color ="black") +labs(title ="Age Distribution of Team Members",x ="Age",y ="Frequency") +theme_minimal()